Orbit Dashboard
SaaS analytics dashboard with real-time data visualization and team management.
Overview
Orbit is a SaaS analytics platform built for product teams that need to move fast without losing visibility. The core challenge was designing a dashboard that surfaces the right data at the right time — without overwhelming users with noise.
The client came with a clear pain point: their team was spending hours every week pulling data from four different tools and assembling reports manually. Orbit replaced that entire workflow with a single, unified interface.
The Problem
Before Orbit, the team was context-switching constantly. Metrics lived in Mixpanel, revenue in Stripe, support tickets in Intercom, and team activity in Notion. Every Monday, someone would spend two hours assembling a report in Google Sheets.
"We were drowning in data but starving for insights." — Product Lead, Orbit
The ask was clear: build one place where everything lives, updates in real time, and tells a story instead of just showing numbers.
Process
Discovery
I started with a week of stakeholder interviews and competitive analysis. I mapped the existing data sources, identified which metrics actually drove decisions, and built a lean information architecture before touching any code.
Key insight from research: users didn't need more data — they needed better defaults. The first version would focus on three core views: Overview, Growth, and Team Activity.
Design
Wireframes in Figma first. Low-fidelity to get alignment on structure, then high-fidelity for the final UI. I designed a custom data visualization system where every chart follows the same visual grammar — same color scale, same interaction patterns, same empty states.
The design system included:
- 8 chart variants (line, bar, area, funnel, donut, sparkline, heatmap, scatter)
- A metric card component system with delta indicators
- A responsive grid layout that adapts from 4-column desktop to single-column mobile
Development
The stack was chosen for speed and scalability:
- Next.js App Router for the shell and routing
- Supabase for the database, auth, and real-time subscriptions
- Recharts for data visualization, customized heavily with Tailwind tokens
- TypeScript end-to-end with strict mode enabled
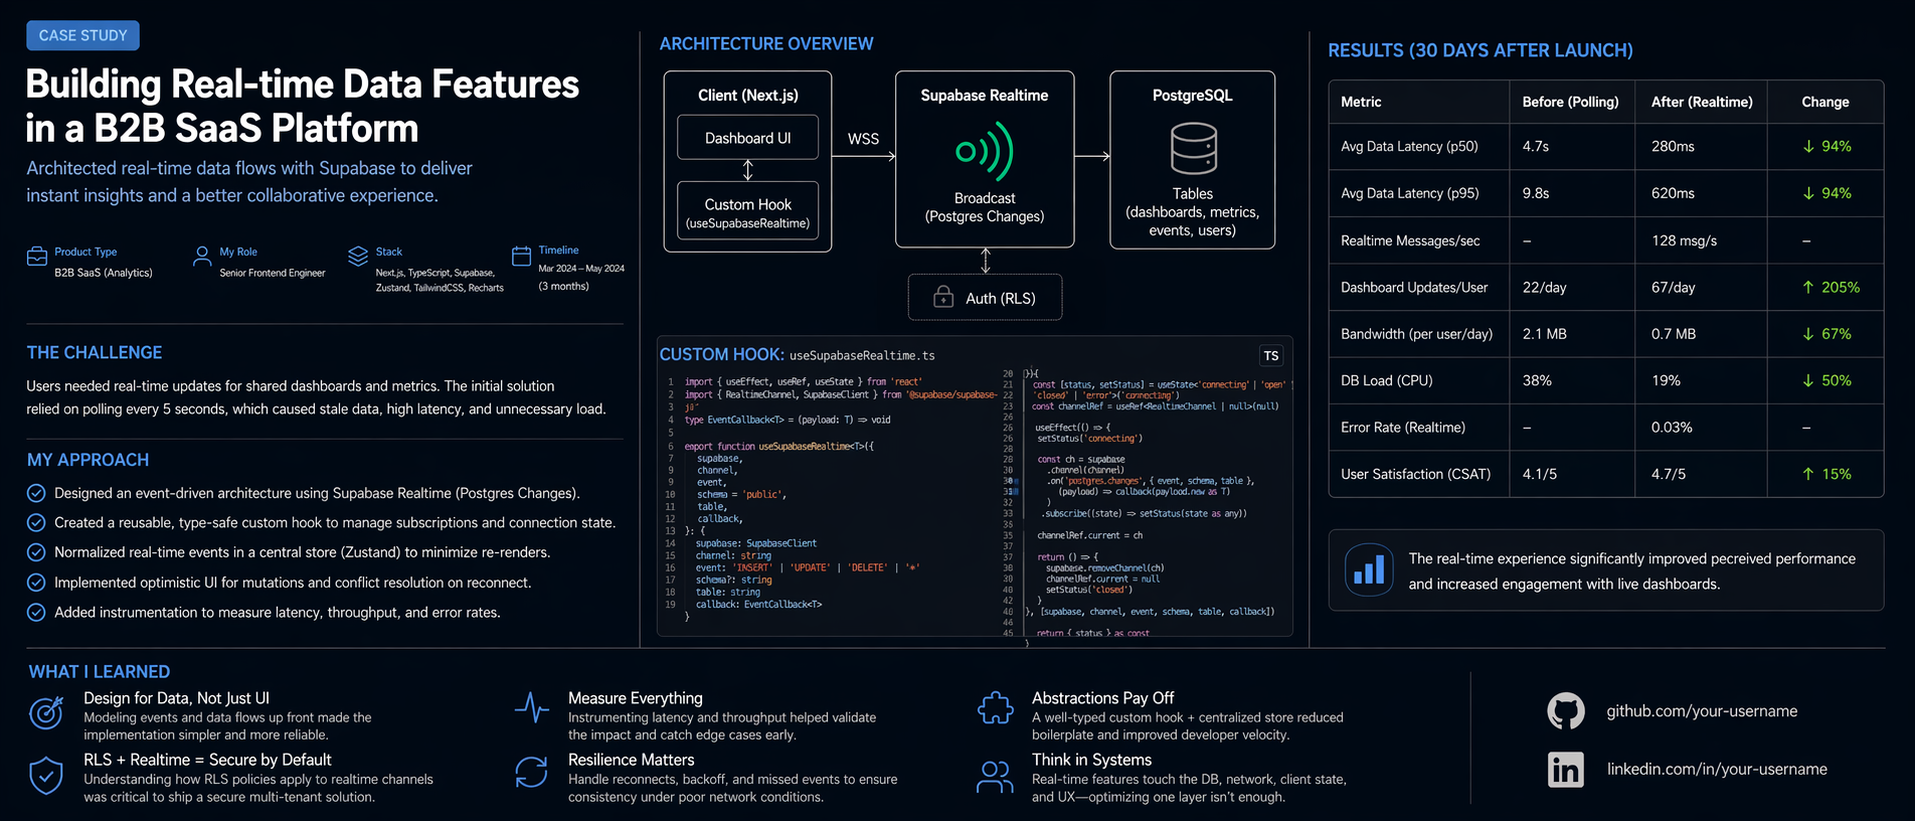
Real-time updates were the trickiest part. I used Supabase's Postgres LISTEN/NOTIFY via their Realtime client, with a custom hook that manages subscription lifecycle and reconnection logic.
// Custom hook for real-time metric subscriptions
export function useRealtimeMetric(metricId: string) {
  const [value, setValue] = useState<MetricSnapshot | null>(null)

  useEffect(() => {
    const channel = supabase
      .channel(`metric:${metricId}`)
      .on(
        "postgres_changes",
        {
          event: "INSERT",
          schema: "public",
          table: "metric_snapshots",
          filter: `metric_id=eq.${metricId}`,
        },
        (payload) => setValue(payload.new as MetricSnapshot)
      )
      .subscribe()

    return () => { supabase.removeChannel(channel) }
  }, [metricId])

  return value
}
Key Features
- Real-time dashboard — metrics update live without polling
- Customizable layouts — users can pin, resize and reorder widgets
- Team management — invite members, assign roles, control data access
- Custom date ranges — compare any period against any other period
- Automated reports — schedule weekly/monthly PDF exports via email
- Dark mode — system-aware, with manual override
Results
| Metric | Before | After | |---|---|---| | Weekly reporting time | ~2 hours | ~8 minutes | | Data sources unified | 4 separate tools | 1 dashboard | | Dashboard load time | — | 1.1s (p95) | | Team adoption | — | 94% weekly active |
The client went from spending 2 hours on weekly reports to 8 minutes. The platform currently serves 10,000+ users across 200+ teams.
What I Learned
Building a real-time product at scale surfaced some interesting lessons:
Optimistic UI is non-negotiable. When users interact with live data, any perceived latency feels broken. Every mutation needed to update the UI immediately and reconcile with the server response in the background.
Empty states are product design. The first-run experience — before any data exists — needed as much design attention as the full dashboard. A confusing empty state kills activation.
Chart libraries need heavy customization. Recharts is powerful but opinionated. I ended up wrapping every chart type in a custom component to enforce consistent styling, animation curves, and responsive behavior.